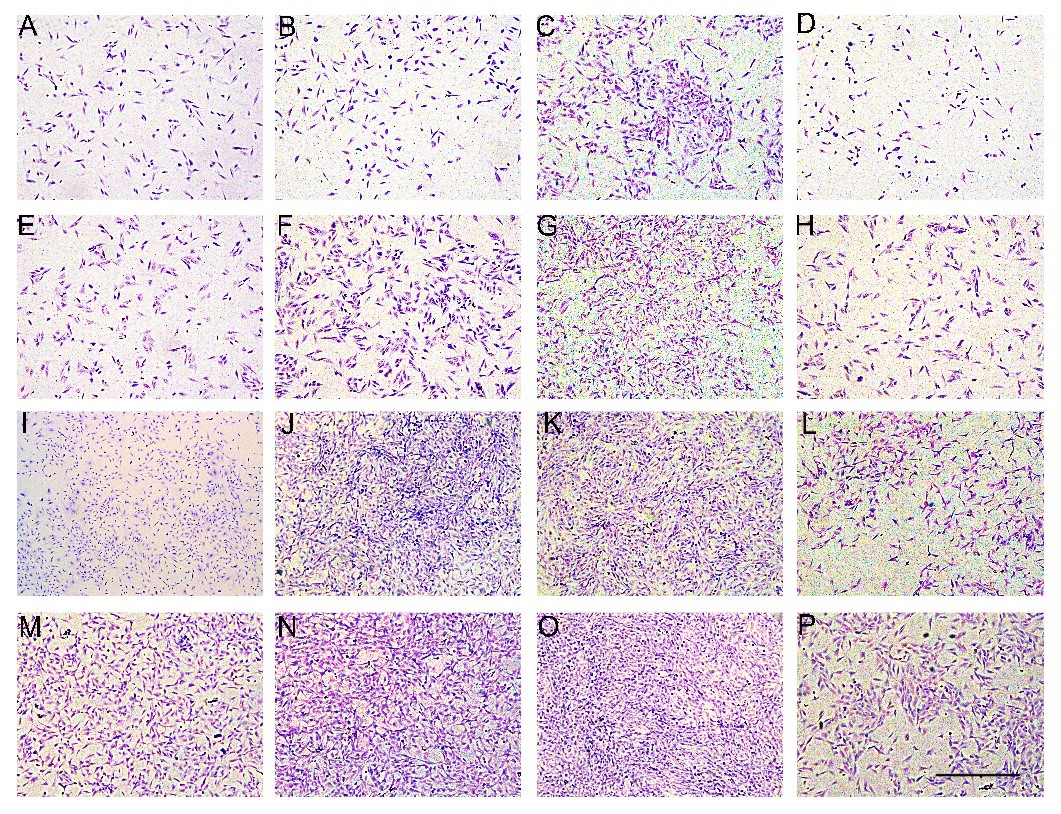
Fig. 4. HE staining of osteoblasts cultured with various concentrations of AP over time. (A-D ,EH, I-L, M-P) Staining of osteoblasts at various concentrations ( 0 µ M , 4 . 4 6 µ M , 8.92µM, and 17.84 µM) of AP on day 3,5,7,9, respectively. The scale bar is 1000µm.